
Conclusion first
When the 20th century GISS temperature is modified according to Tom Karl, et.al., it causes the 21st century sea level predictions of Vermeer’s and Rahmstorf’s semi-empirical model to go down!
Details
I have written extensively about “Global sea level linked to global temperature,” by Vermeer and Rahmstorf (which I will refer to as VR2009).
VR2009 was a widely cited claim of using historical 20th century sea level and temperature data to calculate parameters that could be used to build a model to predict 21st century sea level rise for various 21st century temperature scenarios. I reproduced the VR2009 model based on their description. My code was verified by reproducing the VR2009 results using the same inputs that they used.
I spent a lot of time pointing out some of the bizarre results of their model that surely disqualified it form being taken seriously, some of which can be seen here, here, and here.
I also spent a lot of time pointing out that the VR2009 choices of 20th century sea level data sources left much to be desired. For example, they used the 2006 Church and White sea level data that was already outdated. If they had used the revised Church and White data, then their resulting sea level rise predictions for the 21st century would have been much lower.
They happily modified Church’s and White’s outdated sea level data by subtracting a reservoir correction (Chao, et. al.), which made their 21st century predictions for sea level rise go up. But they made no attempt to estimate a groundwater depletion correction. It turns out, unsurprisingly, that the groundwater depletion is of the same magnitude as the reservoir correction (Wada, et. al.), and including it would have made their 21st century predictions go down.
Nevertheless, Rahmstorf would later claim that his modeling approach was “robust!” That is, it would give essentially the same result for the 21st century given different sources of 20th century sea level data.
So, I also implemented the VR2009 technique using several different sources of sea level data, which should have given similar results, according to Rahmstorf’s claim of robustness. In fact, they gave widely varying results, and every combination of sea level data, reservoir data, and groundwater depletion data that I tried gave lower results than VR2009’s chosen combination.
New Temperature Data!
The widely reported nearly two decade long pause in global warming was causing suicidal ideation among hard-core global warming alarmists. Something had to be done to stop them from slitting their wrists with shards of glass from their shattered thermometers.
Just in the nick of time – revised temperature data! Like all proper revisions of temperature data, this revision caused the reported temperature change of the 20th century to go up.
This was a result of a paper by Tom Karl, et. al. (Nature) based on very thin reasoning (see for example) that argued for such revision. The folks at GISS (who provided VR2009’s temperature data) glommed onto Karl’s logic and subsequently revised their temperature data accordingly. Other temperature data source like UAH and RSS did not.
Which means we must ask ourselves, what happens to 21st century sea level rise predictions based on the VR2009 model using the now modified GISS data?
VR2009 applied their model to six families of temperature scenarios for the 21st century form the IPCC’s 4th Assessment Report. Let’s see what happens to each of those scenarios when we update the 20th century GISS temperature data.
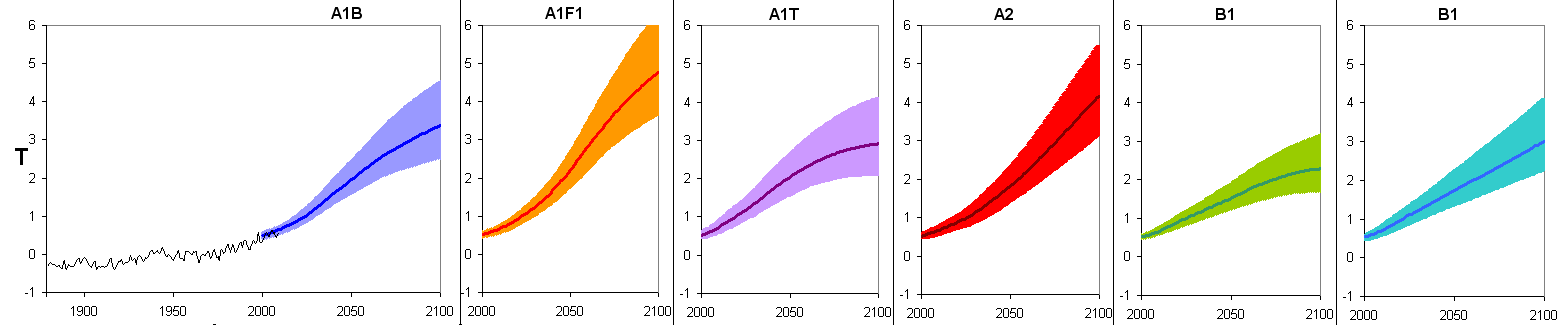
The IPCC temperature scenarios that VR2009 used for prediction of 21st century sea level rise.
Case 1.
Sea level inputs are identical to what VR2009 used: Church’s and White’s sea level with the Chao reservoir correction. The old GISS temperature data is replaced with the new GISS temperature data. The table below shows that the new GISS data yields 21st century sea level rises that are about 17% less than when the old GISS data is used.
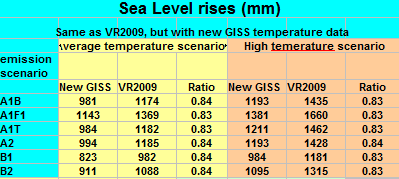
It is a shame that after Tom Karl went to all the trouble to increase the temperature rise of the 20th century it just makes VR2009’s model predict LOWER sea levels for the 21st century. This must be a great disappointment to Vermeer and Rahmstorf, so you can be pretty sure they will never tell you this result. But I just did.
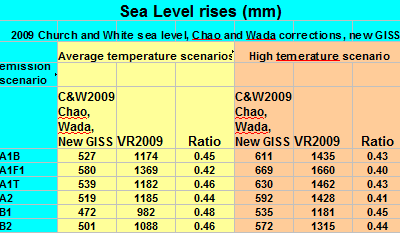
Case 2
As I pointed out previously, VR2009 chose to use outdated 2006 Church and White sea level data, instead of Church’s 2009 data. They also neglected a groundwater depletion correction. When these improvements are included the VR2009 model yields 21st century sea level rises that are only about 55% of VR2009. When the new GISS temperature data is included in the mix this drops to about 45%.
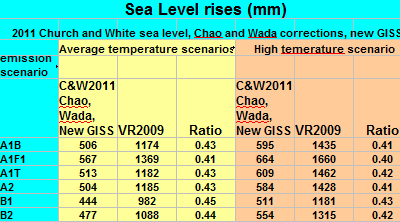
Case 3.
Lest Vermeer or Rahmstorf argue that their large sea level rise rates are saved by another update of the Church and White data in 2011, I have include these results also. The difference between 2009 and 2011 Church and White sea level data was small. Here is how the 2011 Church and White sea level data version plays out in the VR2009 model. The resulting 21st century sea level rise predictions are only about 43% of the VR2009 predictions.
The trend continues.
It seems that no matter what combination of inputs that are used in the VR2009 model, the predicted sea level rise for the 21st century is always smaller than with VR2009’s choice of inputs. I wonder what that implies?
![8518750[1]](https://climatesanity.files.wordpress.com/2015/02/85187501.png)


