
The avid outdoors-man and eminent scientist, Barack Obama, has been trekking through Alaska lately. He is lamenting the demise of the great glaciers of the North. He is surely grieving over the harm that man is inflicting on the planet by spewing his toxic CO2. The Washington Post reports…
Standing near the foot of the Exit Glacier, which has receded 1.25 miles since 1815 and 187 feet last year alone, Obama said “this is as good of a signpost of what we’re dealing with it comes to climate change as just about anything.”
The man certainly has a way with words – a true poet.
I guess we are supposed to be alarmed because 187 feet per year is a lot faster than 1.25 miles per 200 years. After all, 1.25 miles in 200 years averages out to only 33 feet per year. The message we are supposed to get is that the Exit Glacier is receding about 6 times faster now than its average over the last 200 years. This, of course, is due to the CO2 that vile humans use to poison the atmosphere and it means endless and escalating disaster unless we socialize the economy of the world.
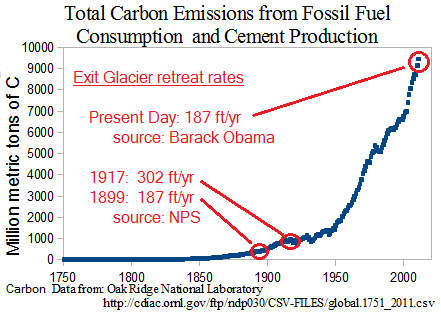
But what does the National Park service say about the retreat rate of Exit Glacier? The following table of retreat distances and rates comes from the National Park Service’s “The Retreat of Exit Glacier.” Annotation in red was added by me.
 So, this data confirms Obama’s assertion that the Exit Glacier has retreated 1.25 miles in the last 200 years. But it also makes it quite clear that it was retreating as fast, or faster, 100 years ago.
If CO2 is the culprit today, what was the culprit 100 years ago? The following graph shows the amount of anthropogenic CO2 in the atmosphere as a function of time going back to 1750. The data comes from Oak Ridge National Laboratory. I made the plot and added the annotation. It’s kind of hard to explain why the retreat rate was so much greater in the past when there was less than 10% of the anthropogenic atmospheric CO2 than there is today. Perhaps Professor Obama will elucidate.
 My wife and I were up in Alaska a few years ago, and we also visited some some of those receding glaciers. At Glacier Bay National Park, which is several hundred miles southeast of Exit Glacier, I happened to pick up a park pamphlet that had the following series of illustrations showing the glacier extents in the park going back to 1680.
 The first thing that jumps out at you is the rapid ice advance between 1680 and 1750 and the subsequent retreat between 1750 and 1880. The pamphlet said
“The Little Ice Age came and went quickly by geologic measures. By 1750 the glacier reached its maximum, jutting into Icy Strait. But when Capt. George Vancouver sailed here 45 years later, the glacier had melted back five miles into Glacier Bay – which it had gouged out.”
As an aside, a co-worker once told me that the Little Ice Age was not a global phenomenon, but rather, local to Europe. He cited the Union of Concerned Scientists as the source of this insight. But there it is, in Alaska!
It is hard to argue with the Union of Concerned Scientists because they’re, well, scientists. Not just anybody can be a Concerned Scientist. You have to send a check first. My wife used to send a check years ago, but it was from our joint account so I figure I was only half a Concerned Scientist then. Now I guess I am just a wholly unconcerned scientist.
 Anyway, Obama was getting excited about 1.25 miles of glacier recession since 1815, and a whopping 187 feet in the last year. That pamphlet that I mentioned also had a large map of the Glacier Bay area marking the location of the various glaciers back to 1760. It’s easy to string the locations together and calculate the recession rate of these glaciers. The image at the left shows the map as I marked it out for Grand Pacific Glacier. (Click to enlarge.)
I have plotted the distance as a function of time for three glacier routes using this crude method. As you can see below, these glaciers have receded at a much faster rate than Exit Glacier. But Exit Glacier and the Glacier Bay National Park glaciers have one thing common: they all retreated at their maximum rate back when anthropogenic atmospheric CO2 levels were very low compared to today.
 Let’s take a closer look at the Grand Pacific Glacier. John J. Clague and S. G. Evans (J. of Glaciology) used various data sources to plot the retreat of the Grand Pacific Glacier. I have converted their data to miles and overlaid it with my coarser data from the map. The Clague data and the map data agree nicely, but the Clague data fills in some of the gaps. The most interesting point is that like Exit Glacier, the retreat rate for the Grand Pacific Glacier was greatest around the last part of the 19th century. In fact, the Clague data may indicate that the Grand Pacific Glacier was slightly progressing, not retreating, during most of the 20th century.
 It is pretty clear that the Grand Pacific Glacier was retreating fastest around 1860. Where is that on the anthropogenic atmospheric CO2 timeline? The graph below shows that the anthropogenic atmospheric CO2 level was only about 2% of today’s level when the Grand Pacific Glacier was retreating at its fastest by far!
 How is that possible??????? I thought it was high CO2 levels that caused the glaciers to recede.


